
As part of the Phase One trade deal signed in January of 2020, China agreed to increase imports of certain manufactured, agricultural, and energy goods from the United States. These goods are outlined in Annex 6.1 of the Phase One trade deal, covering over $200 billion worth of goods in 2020 dollars if China were to meet these import commitments. Numerous organizations have attempted to use public data to track China’s progress towards these import commitments in 2020 thus far. We pursued a similar analysis at BASC in May of 2020.
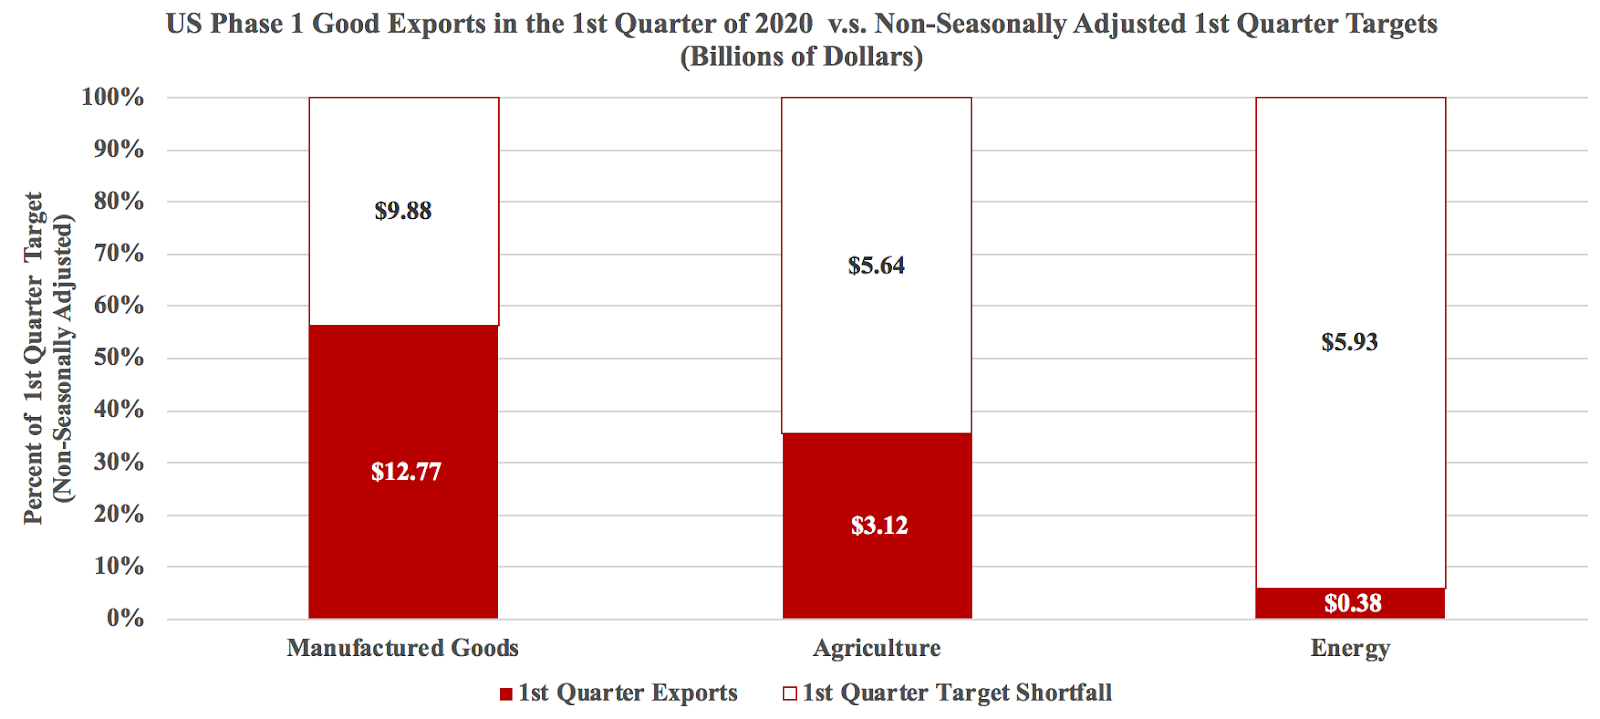
In our analysis we found that for January through March of 2020[1], across the three categories of goods China had met no more than 56% of its Year-to-Date Target, with energy goods lagging behind as much as meeting only 6% of the Year-to-Date Target described in the Phase One Trade deal. These figures, described in Table 1, have been similarly replicated by other organizations like the Peterson Institute of International Economics.
Table 1:
To make our analysis more robust, we attempted to account for seasonal patterns in trade before making a statement about China’s progress towards its import commitments. Accounting for seasonality did have a noticeable impact on the underlying numbers but did not change the conclusion itself. Even accounting for issues with the underlying data, China is nowhere near meeting its Phase One import commitments.
Trade Pattern Seasonality
The year-to-date figures in Table 1 represent a basic analysis assuming an equal distribution of annual trade. Across all goods, US exports from January through March are assumed to represent 25% of annual exports overall. Even initial inspection of month to month overall trade volume in relevant Phase One goods suggests that this may not be a valid assumption as there is clear variation in monthly trade volume indicating seasonality across a single year. This is visually apparent in Figure 1.
Figure 1:
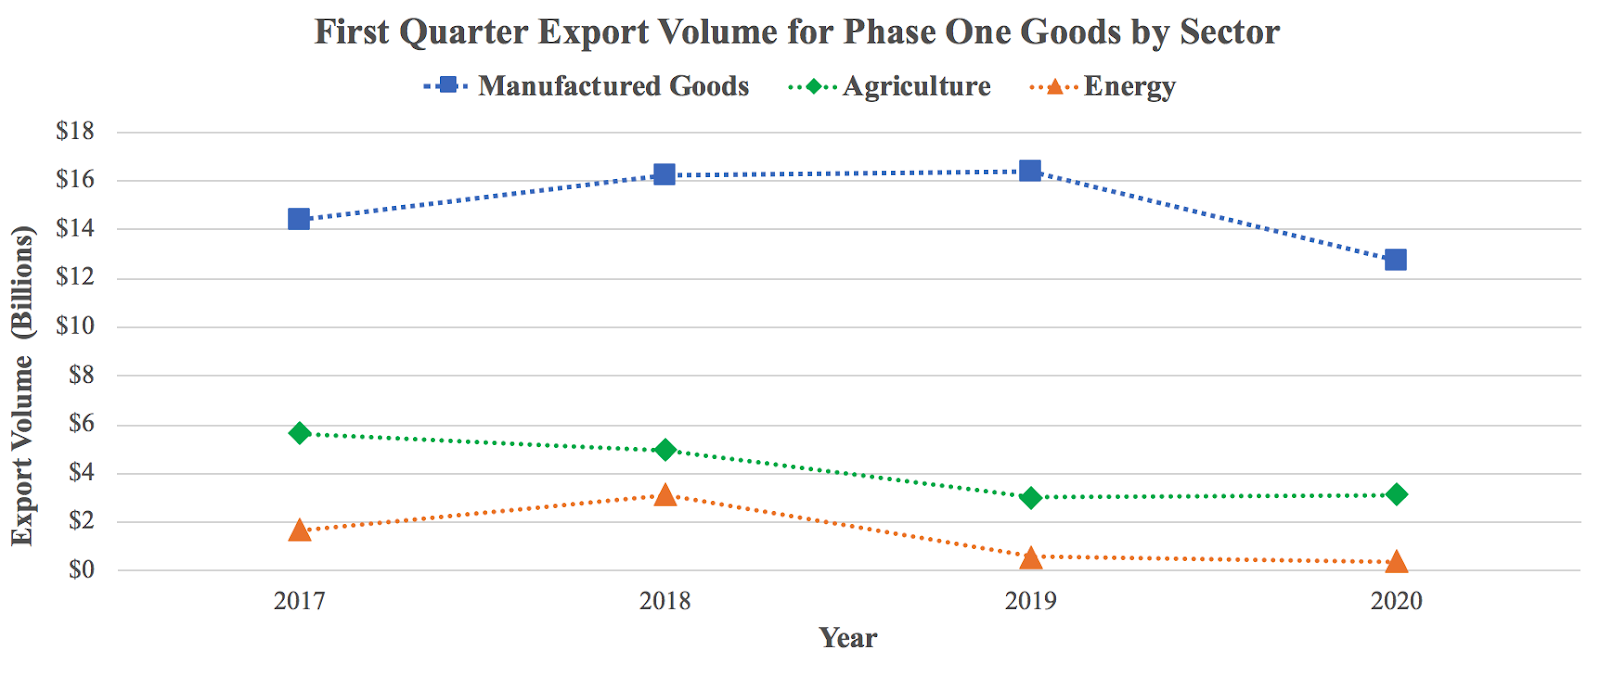
This seasonality varies across good categories as well. As seen in the Figures 2-4 (included in the appendix section) manufactured goods exports seem to peak early in the year while agricultural goods peak towards the end of the year. Energy goods fit right in the middle, peaking in the middle of the year. A more rigorous analysis of China’s progress towards its import commitments would account for these seasonal patterns. If January through March represent a smaller proportion of annual trade than we initially assumed, China may be closer to its import commitments than initially anticipated. The opposite is true if the actual proportion is higher.
Table 2:
As Table 2 indicates, over the last five years the annual percentage of trade attributed to the period from January to March has been as low as 21.2% compared to 25%, the percentage implied by our assumption of equal distribution across a single year. Within goods categories there is even more significant variation. Agricultural trade from January to March can be as high as 47.3% of all annual trade while Energy trade from January to March can be as low as 17.1% of annual trade.
Seasonal Analysis Methodology
In our initial approach we established the Year to Date target by multiplying the annual import commitments for 2020 outlined in the Phase One trade deal by 0.25 across all categories of goods. 0.25 is the proportion of trade that January through March should represent assuming equal distribution.
Adjusting for seasonality on an annual basis without accounting for individual variation between goods, we instead multiply the annual targets by the maximum, minimum, and average proportions from 2015-2019 by each annual target to establish a range that current 2020 exports from January to March should fall within.
Adjusting for seasonality on an annual basis accounting for individual variation between goods, we multiple each category of good’s annual targets by the maximum, minimum, and average proportions from 2015-2019 by its corresponding import target to establish a range that current 2020 exports from January to March should fall within for each category of good.
Results
The results of our analysis are presented in Tables 3 and 4, which present an upper bound estimate and lower bound estimate for the Year to Date Target adjusted seasonally, translated to an upper bound estimate and lower bound estimate for the percentage of the Phase One import commitments that China has met.
Table 3:

Table 4:

Table Three computes seasonality by year, determining an aggregate proportion of annual trade that January through March represents for all goods and applying this adjustment to the Phase One annual targets for all categories of goods. Table Four computes seasonality by good, determining a proportion of annual trade that January through March represents for each category of good. This adjustment is applied to the corresponding Phase One annual target for each category of good.
Discussion
Rather than targeting a single Year-To-Date value computed from the annual Phase One import commitments which assumes that January through March represents a fourth of the year’s exports, this seasonal analysis created a bounded range that January through March exports to China should fall within. If exports from the US to China fell within this range or came close to the lower bound, it could be argued that China is on track to meet its import commitments after adjusting for seasonality.
China does not come close to meeting its import commitments even after adjusting for seasonality both by year and by individual good category. In the most extreme cases, the Year-To-Date target could decrease by almost $2 billion as is the case for energy import commitments adjusted seasonally by good. Despite this, the most optimistic year-to-date percentage met value across all categories does not exceed 60% (manufactured goods adjusted seasonally both by good and by year).
Conclusion
Improving our analysis and making predictions more robust did not change the underlying conclusion itself. Properly accounting for seasonal patterns holds merit in its own right, but the reality is that China is currently not even close to meeting its import commitments as outlined in the US-China Phase One trade deal.
This finding is significant as there is great uncertainty concerning the underlying numbers behind China’s commitment to increase imports of US goods outlined in Annex 6.1 of the Phase One deal. In attempts to replicate the baseline numbers in the Phase One deal, commentators found these numbers are not derived from US Commerce Department data (the approach our analysis replicated), but instead come from a subjective combination of trade data from both the US and China.
“Playing with the numbers”, as we have done in this analysis, could also include various combinations of data from the US and China and technical considerations for issues like the classification of trade with Hong Kong. This will likely not change the conclusion either, as China is too far from its targets for this to be merely an issue with the numbers. From the Phase One deal’s creation, analysts have remarked that the targets seem impossible and the onset of the Covid-19 pandemic, “suggests that what started as a fantasy has become a nightmare”. Robust analyses will not be enough to reconcile China’s lagging import numbers. Structural change in trade policy is needed for Phase One targets to work.
Appendix
Figure 2:

Figure 3:

Figure 4:

[1] Data was only available for this period as of May 2020 due to a lag in the release of trade data by the U.S. Department of Commerce.
The US-China rivalry is shifting into new and unpredictable areas, engulfing everything from a popular video app to Hong Kong’s status as a global financial hub.
The latest tensions are overshadowing a trade agreement in January that was meant to draw a line under the trade war and be a boon for business. Instead, differences between both powers are deepening right at a time when the world economy is facing its worst crisis since the Great Depression.
This week alone, President .. President Donald Trump said he is considering banning ByteDance Ltd.’s short video app TikTok as retaliation against China over its handling of the coronavirus. Some of his top advisers want the US to undermine the Hong Kong dollar’s peg to the greenback to punish China for recent moves to chip away at the former British colony’s political freedoms. There are even concerns over the visa status of hundreds of thousands of Chinese students who enroll at US colleges and universities each year.
..
wow this is a coherent and indepth analysis
Very robust and insightful analysis! Could expect any better from the Econ departments research. Now it’s time for Goldman to step in and offer policy recommendations for how the US can increase accountability with China’s P1 commitments in the trade deal. Another question to ask is, how will delays in the supply chain (U.S.) caused by COVID-19 affect China’s ability to meet import targets?
Vincent, this was a very comprehensive and insightful analysis. Couldn’t expect any better from the Econ departments research! Now it’s time for Goldman to step in and offer policy recommendations for how the US can increase accountability with China’s P1 commitments in the trade deal. At what point will China decide on maintaining the best interests of their domestic supplies over international imports? Another question to ask is, how will delays in the supply chain (U.S.) caused by COVID-19 affect China’s ability to meet import targets? Does the perception of consumers in other countries change with the slow recovery of the U.S.?
Great analysis, Vincent!
i think both country need each other
but US use that ego